
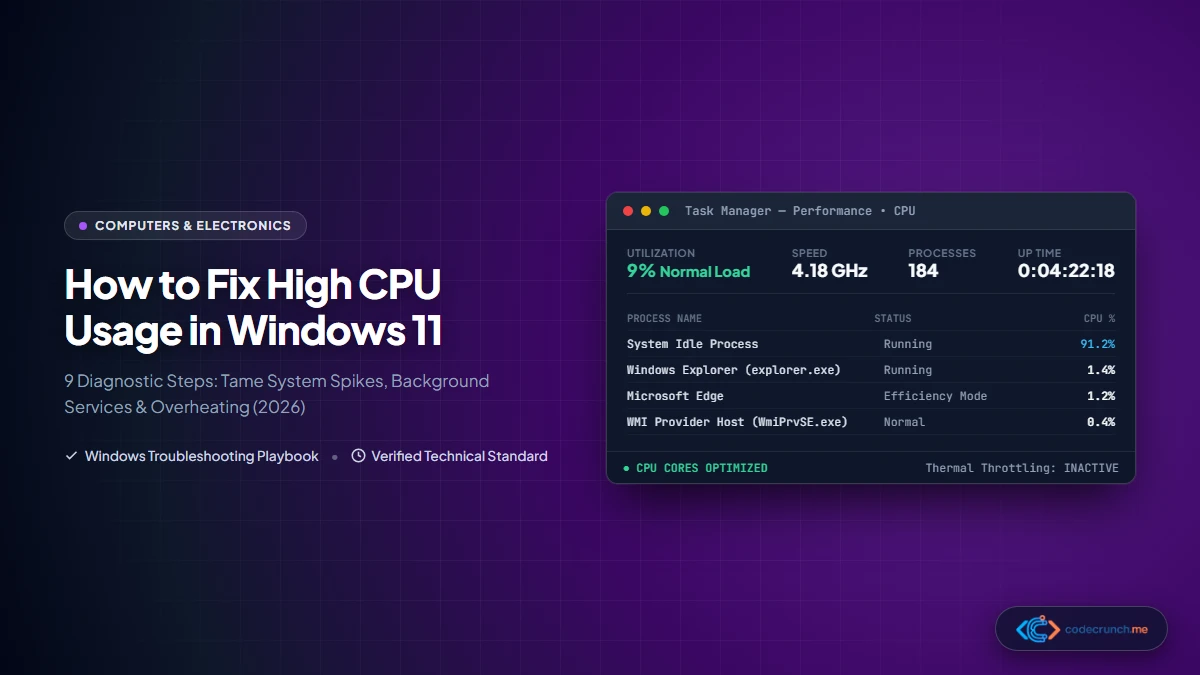
Few computer problems are as frustrating as opening your laptop or desktop only to hear its cooling fans screaming at maximum RPM while basic mouse movements hitch, video playback stutters, and the Windows Task Manager reveals a catastrophic 100% CPU utilization lockup.
When your processor remains pinned at maximum capacity, every background task starves for thread execution time. While many generic PC guides hastily recommend wiping your computer or purchasing expensive hardware upgrades, the vast majority of Windows 11 CPU spikes are caused by misconfigured background services, corrupted Windows servicing stacks, driver interrupt storms, or aggressive thermal throttling. In our foundational guide on speeding up slow PCs, pinpointing CPU bottlenecks is the primary step toward restoring responsiveness.
This technical troubleshooting playbook delivers 9 systematic, verified diagnostic steps to identify the exact rogue process, restore normal processor frequencies, and permanently eliminate unexplainable CPU usage spikes in Windows 11.
- 1. Understanding CPU Telemetry: Task Manager vs Resource Monitor
- 2. Triaging Windows System Processes (WMI, SearchIndexer, tiworker)
- 3. Step 1: Rebuilding the Windows Search Index Database
- 4. Step 2: Isolating WMI Provider Host (WmiPrvSE.exe) Service Leaks
- 5. Step 3: Auditing Background Startup Applications & Telemetry
- 6. Step 4: Repairing Windows Image Files (DISM & SFC)
- 7. Step 5: Configuring Windows Power Plans & CPU Minimum States
- 8. Step 6: Detecting Cryptojacking Malware with Offline Scans
- 9. Step 7: Resolving DPC Interrupt Storms & Faulty Audio/GPU Drivers
- 10. Step 8: Identifying Hardware Thermal Throttling & Clock Drops
- 11. Step 9: Clearing Windows Update SoftwareDistribution Stalls
- 12. Frequently Asked Questions (FAQ)
1. Understanding CPU Telemetry: Task Manager vs Resource Monitor
Before modifying any system settings, you must accurately identify which software layer is consuming processor cycles. A frequent beginner trap is confusing System Idle Process with genuine resource consumption.
Press Ctrl + Shift + Esc to launch Windows Task Manager, switch to the Processes tab, and click the CPU column header to sort descending. If you observe “System Idle Process” sitting at 85% to 95%, your computer is actually operating normally: this virtual metric measures the percentage of CPU capacity that is currently idle and available.
However, if third-party executables or Windows background services consistently consume 50% to 100% of CPU time while sitting on an empty desktop, you are dealing with a runaway worker thread. For deeper inspection, launch Resource Monitor by pressing Win + R, typing resmon.exe, and navigating to the CPU tab.
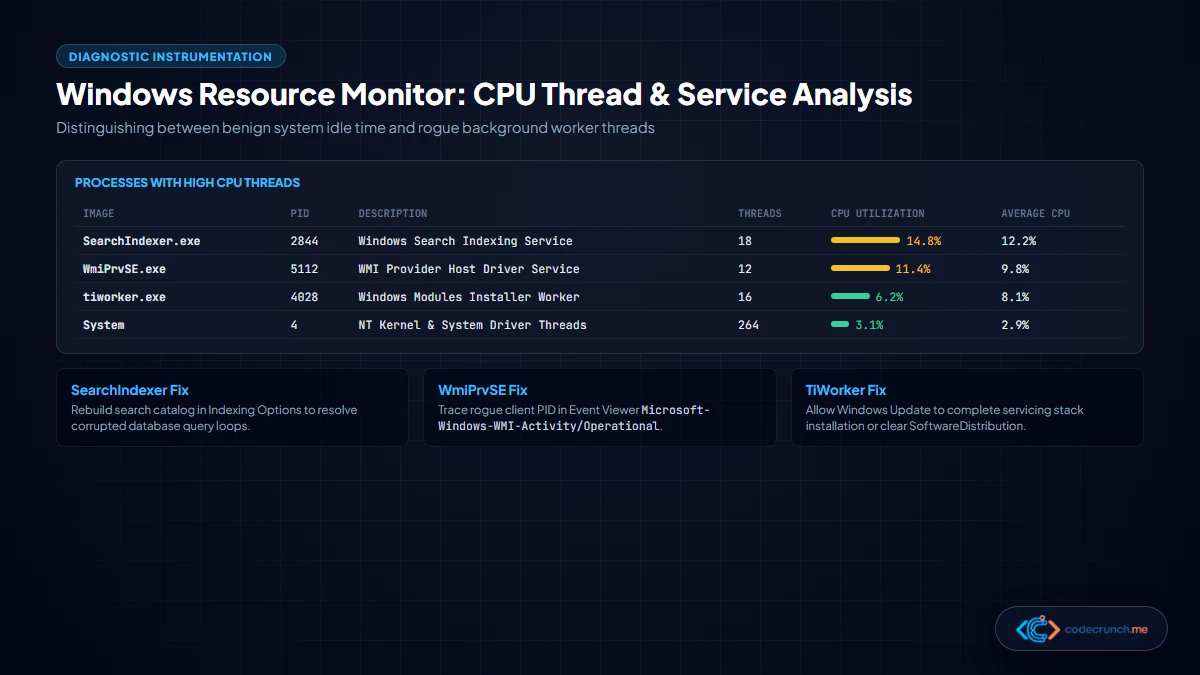
Resource Monitor distinguishes between average CPU utilization over 60 seconds and momentary micro-spikes. As documented in Microsoft Sysinternals Process Explorer Documentation, focusing on sustained multi-minute thread usage separates legitimate system maintenance from rogue execution loops.
2. Triaging Windows System Processes (WMI, SearchIndexer, tiworker)
Most mysterious Windows 11 CPU loads trace back to one of four legitimate system processes stuck in an error loop:
| Process Executable | Legitimate Windows Role | Trigger for 100% CPU Lockup | Resolution Path |
|---|---|---|---|
SearchIndexer.exe | Indexes file metadata for instant Start Menu searches. | Corrupted Windows.edb database or infinite loop indexing large code repositories. | Rebuild index catalog & add repository exclusion paths. |
WmiPrvSE.exe | Windows Management Instrumentation provider service for hardware telemetry. | A buggy third-party client program sending endless WMI query bursts. | Trace rogue ClientProcessId in Event Viewer. |
tiworker.exe / TrustedInstaller | Windows Update Component Servicing Stack. | Stalled update packages or broken delta compression files. | Reset SoftwareDistribution cache folder. |
System (ntoskrnl.exe) | Windows NT Kernel and core device drivers. | Deferred Procedure Call (DPC) driver interrupt storm (faulty audio/Wi-Fi driver). | Analyze DPC latency with LatencyMon & update chipset drivers. |
3. Step 1: Rebuilding the Windows Search Index Database
If SearchIndexer.exe is continuously using 20% to 50% CPU, its underlying Extensible Storage Engine database (Windows.edb) is likely corrupted or repeatedly scanning massive nested folders (such as node_modules directories in software development workspaces).
- Press Win + S, type Indexing Options, and press Enter.
- Click Modify. Ensure your massive development workspaces, virtual machine virtual disks, or game directories are unchecked from indexing.
- Click Advanced, and under the Troubleshooting header, click the Rebuild button.
- Windows will delete the bloated, corrupted database and generate a clean, lean index in the background.
4. Step 2: Isolating WMI Provider Host (WmiPrvSE.exe) Service Leaks
WmiPrvSE.exe acts as an intermediary bridge allowing applications to query hardware status, battery levels, and fan speeds. When it spikes to high CPU, the process itself is rarely at fault; rather, another program is hammering it with thousands of malformed queries per second.
Do not simply kill the process. Follow this sysadmin procedure to identify the guilty program:
- Press Win + X and select Event Viewer.
- In the left tree, navigate to:
Applications and Services Logs > Microsoft > Windows > WMI-Activity > Operational. - Look for recent events with level Error (Event ID 5858). Click on an error.
- In the bottom preview window, locate the field
ClientProcessId = [XXXX](for example,ClientProcessId = 4128). Note this 4-digit number. - Open Task Manager, switch to the Details tab, and click the PID header to sort numerically.
- Locate the exact process matching that PID. You will discover the offending application—frequently proprietary motherboard RGB software, obsolete hardware monitoring utilities, or aggressive OEM bloatware. Uninstall or update the identified application.
5. Step 3: Auditing Background Startup Applications & Telemetry
Every background application installed on your PC launches helper utilities, auto-updaters, and notification tray icons. Over time, dozens of background processes compete for CPU cycles. In our troubleshooting analysis for system RAM capacity, background tasks silently degrade overall computing throughput.
- Open Task Manager and click on the Startup apps tab (the speedometer/grid icon on the left rail).
- Inspect the Startup impact column.
- Right-click and Disable non-essential applications: Discord, Spotify, game launchers (Steam/Epic), Adobe Creative Cloud updaters, and cloud sync clients that you do not need running at boot.
- Next, navigate to Windows Settings > Apps > Installed apps, and uninstall software suites you no longer use.
6. Step 4: Repairing Windows Image Files (DISM & SFC)
Corrupted Windows system DLLs cause Windows subsystem processes (like explorer.exe or dwm.exe) to repeatedly crash, restart, and loop, generating massive CPU spikes. You can repair these files using Microsoft’s native command-line repair utilities.
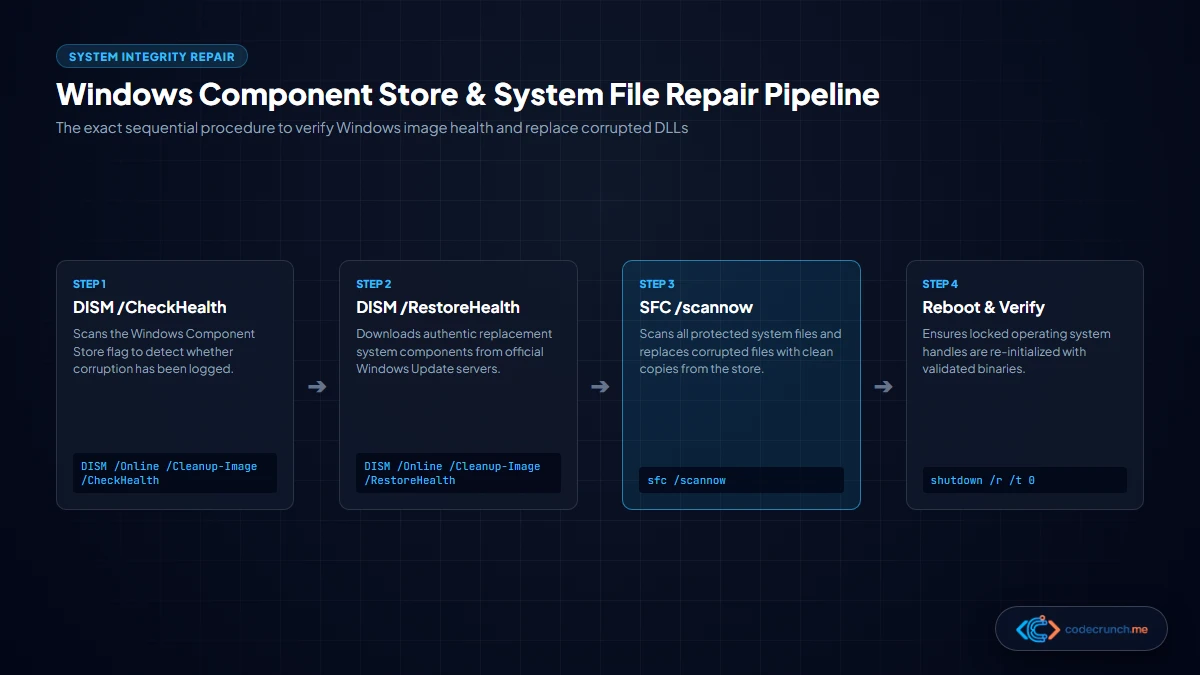
Always run DISM before SFC. DISM repairs the master backup component store from Microsoft’s update servers; SFC then uses that validated store to repair local system files:
# Launch PowerShell or Terminal as Administrator

# Step 1: Scan and repair Windows Component Store corruption
DISM.exe /Online /Cleanup-image /Restorehealth

# Step 2: Scan protected system files and replace damaged copies
sfc /scannow
If SFC reports “Windows Resource Protection found corrupt files and successfully repaired them,” reboot your computer immediately with shutdown /r /t 0 to complete the servicing operation.
7. Step 5: Configuring Windows Power Plans & CPU Minimum States
In Windows 11, power plans dictate how aggressively the CPU downclocks when idle. Occasionally, power plan corruption or third-party overclocking utilities lock the processor’s Minimum Processor State to 100%, preventing the CPU from entering low-power C-states even with zero running tasks:
- Press Win + R, type
powercfg.cpl, and press Enter to open classic Power Options. - Click Change plan settings next to your active power plan, then click Change advanced power settings.
- Expand Processor power management > Minimum processor state.
- Ensure the value is set to 5% (for both On battery and Plugged in), not 100%.
- Expand Maximum processor state and verify it is set to 100%. Click Apply.
8. Step 6: Detecting Cryptojacking Malware with Offline Scans
Modern cryptocurrency mining malware is engineered with evasion techniques: when you open Task Manager, the miner detects the Task Manager process and instantly pauses itself to avoid detection, resuming the moment Task Manager is closed!
If your computer fans accelerate the second you close Task Manager, perform a dedicated Windows Defender Offline Scan. Because offline scans boot into a temporary mini-WinPE environment before Windows kernel and malware drivers load, stealth miners cannot hide:
- Open Windows Settings > Privacy & security > Windows Security > Virus & threat protection.
- Click Scan options.
- Select Microsoft Defender Antivirus (offline scan) and click Scan now.
- Your PC will reboot into a 15-minute isolated scanner that remediates persistent rootkits and cryptominers.
9. Step 7: Resolving DPC Interrupt Storms & Faulty Audio/GPU Drivers
If Task Manager displays high CPU under System or System interrupts (interrupt latency), your hardware is experiencing a Deferred Procedure Call (DPC) storm. This occurs when a faulty hardware driver continuously spams the CPU with hardware interrupts, preventing the operating system from executing regular user-mode code.
The most common culprits are Realtek audio drivers, outdated Wi-Fi network card drivers, and conflicting GPU graphics software. As explained in our guide on fixing Windows Blue Screen of Death errors, driver-level interrupts represent the lowest and most sensitive layer of Windows stability.
- Download and run the free diagnostic tool LatencyMon. Click the green Start button.
- LatencyMon will identify the exact
.sysdriver file generating excessive execution times (e.g.ndis.sysfor network,nvlddmkm.sysfor Nvidia GPU, orrtwlane.sysfor Realtek Wi-Fi). - Visit the official manufacturer website (Dell, HP, Lenovo, or motherboard manufacturer) and download the latest certified OEM driver package.
10. Step 8: Identifying Hardware Thermal Throttling & Clock Drops
Sometimes, high CPU percentage is not caused by heavy software demand, but by artificially restricted CPU capacity. When a laptop or desktop processor overheats, its internal temperature sensor crosses the Tjunction (junction temperature) limit—typically 95°C to 105°C.
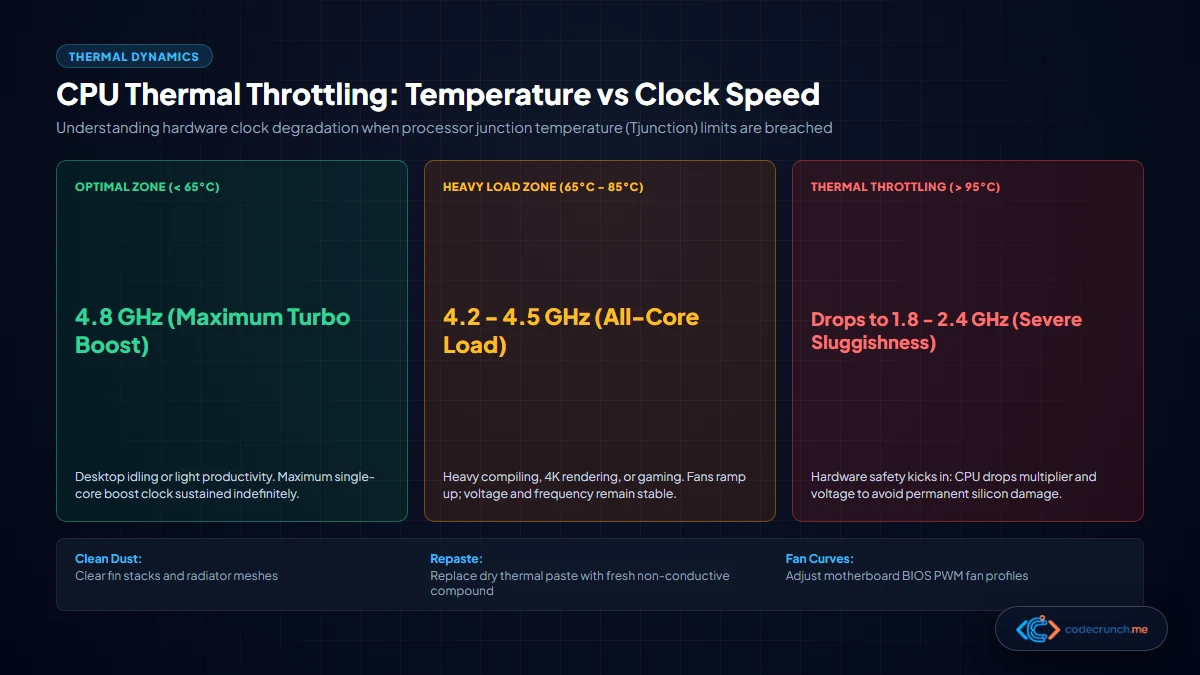
When throttling occurs, the CPU multiplier drops automatically from 4.5 GHz down to 0.79 GHz or 1.2 GHz to avoid silicon degradation. At 0.79 GHz, even trivial background tasks consume 100% of the severely throttled processor cycles! Check your clock speed in Task Manager > Performance > CPU: if speed is frozen under 1.0 GHz despite heavy workloads, address hardware cooling:
- Clean dust accumulation from laptop exhaust vents and desktop radiator fins using compressed air.
- Elevate laptop bases off soft surfaces (like beds or carpets) to maintain clear intake airflow.
- On systems older than 3 years, replace dried factory thermal compound with fresh non-conductive thermal paste.
11. Step 9: Clearing Windows Update SoftwareDistribution Stalls
If tiworker.exe or svchost.exe pins your CPU following a recent patch cycle, a Windows Update package is caught in a download or unpacking loop. Resetting the servicing cache resolves this permanently:
# Stop update servicing daemons
net stop wuauserv
net stop cryptSvc
net stop bits
net stop msiserver

# Rename corrupted cache repositories
ren C:\Windows\SoftwareDistribution SoftwareDistribution.old
ren C:\Windows\System32\catroot2 catroot2.old

# Restart update servicing daemons
net start wuauserv
net start cryptSvc
net start bits
net start msiserver
Navigate to Windows Settings > Windows Update and click Check for updates to download clean, verified patch manifests from Microsoft servers.
12. Frequently Asked Questions (FAQ)
Is 100% CPU usage dangerous for my computer?
Temporary 100% CPU usage while exporting a 4K video, compiling code, or launching a demanding game is completely safe and normal. Modern processors are designed to run at full capacity. However, continuous 100% CPU usage while your computer is idling on the desktop is harmful: it increases electricity consumption, causes thermal wear, degrades battery lifespan, and makes the system sluggish.
Why does System Idle Process show 99% CPU?
System Idle Process is not a program consuming your CPU; it is an operating system accounting metric showing how much CPU capacity is currently unused. A high percentage (like 90% or 98%) means your computer has plenty of processing headroom and is running efficiently.
Can a dying SSD cause high CPU usage?
Yes. When a solid-state drive or hard drive encounters bad sectors or read timeouts, Windows enters an I/O wait state. In Task Manager, the CPU spends excessive cycles managing disk interrupt requests and queue retries. Review our diagnostic comparison between SSD, HDD, and NVMe health diagnostics to evaluate your drive status with SMART tools.
Should I use third-party “PC Cleaner” software to fix CPU spikes?
No. Third-party “cleaners”, registry tweakers, and RAM boosters often make CPU usage worse by running intrusive background telemetry daemons, installing unwanted adware, and deleting essential Windows servicing keys. Rely exclusively on native Windows tools like Task Manager, Resource Monitor, DISM, SFC, and Windows Defender.